What Are Tide Tables And How to Read Them

As a diver, you probably already have some understanding of tides and tidal movements, since these natural phenomena can influence your dives greatly. However, by far not all divers know how to read tide tables and put the obtained information to good use. In this article, we’ll try to go over all the essential things you need to remember about tides and tide tables.
Tides: What Are They?
Let us start with the basics and reacquaint ourselves with the phenomena of tides and tidal movements. Tides are defined as the rise and fall of sea levels, caused by the combined effects of gravitational forces of the Moon, the Sun and the rotation of Earth. Depending on the position of the Moon and the Sun, two types of tides can occur. “Spring” tide appears when the Moon and the Sun are aligned with the Earth, whereas the “neap” tide is formed when the moon is at right angles to the line between the earth and the sun.

Because the Moon is our closest neighbor in the solar system, it makes the greatest impact on tidal movements. Tides, created by the gravitational forces of the Moon vary from high to low. The difference between the high and low tides determines the "tidal range", the depth of water in any one spot throughout the day. This tidal range typically changes twice daily, since the lunar high tides occur every 12 hours and 25 minutes, which means that it takes six hours and 12.5 minutes to go from high tide to low tide or vice versa.
In addition to that, we need to consider the annual variable difference in distance between the Moon and the Earth. Due to the fact that the Moon follows an elliptical path around the Earth, the change in the distance between the two is big enough to influence the height of the associated tide. When the Moon is at perigee (closest to Earth), the tides are higher than usual. At apogee (when the Moon is farthest) tides are lower.
So, we can sum it up by stating that twice a day the water goes up and twice a day the water goes down. During the time in between, there is a current pushing water in or sucking it out.
While this amount of information is sufficient for a fascinating cocktail party conversation, you still need to know more if you want to become an independent, self-sufficient diver, and plan your own dives.
On the local scale, tides are influenced by geological differences in the shape of the ocean floor and coastline dynamics, as well as wind and weather conditions. For example, a narrowing inlet can increase the speed of the tidal currents, while islands in the open ocean don‘t usually experience significant tides. Pressure changes can also affect the incoming tides - high-pressure systems depress sea levels, while low-pressure systems produce tides higher than predicted. So, when traveling to an unfamiliar dive location, try to learn as much as possible about the area.
Why Divers Need Tide Tables
As we have already learned, tides move massive amounts of water in fairly small amounts of time. Therefore, they can significantly affect the depth and accessibility of the dive site, especially in the areas with a considerable tidal shift. For example, during the low tide, you might be able to explore dive sites that are too deep for your experience level at high tide.
On the other hand, tides can create strong currents, which are dangerous for divers without proper preparation and sufficient experience level.
Keep in mind that tidal activity can also affect visibility, as tiny particles and organisms move from one place to another together with the water. While the information of this sort cannot be found in tide tables, you can always ask for advice at local dive centers.
Luckily, despite the various factors that influence tidal movements, tides are pretty predictable at specific locations. This allows such agencies as the National Oceanic and Atmospheric Administration’s (NOAA’s) or National Ocean Service to produce annual Tide Tables. Local newspapers, television and radio stations usually also provide information about predicted tides for the covered areas.
Reading the Tide Table
Now that you know why you need tide tables and where to get them, let’s move on to the most interesting part - learning to read them.
First of all, it’s important to note that while tide charts and tables may be formatted differently, all the necessary information is still there. Normally, every tide table or chart includes the date, time, and height (in meter or feet) for both high and low tides. Because tide heights can vary greatly even within a 10 to 15-mile range, some tables also include the correction part, which allows making the necessary adjustment for your specific area.
When you find the table for your location and date, all you need to do is perform three simple steps.
1. Understand Chart Datum. Keep in mind, that all tidal heights are measured against the defined plane of reference, called Chart Datum. Chart Datum is basically an average of low tide heights. Nautical charts use this same reference to measure depth. If you calculate the tide height in a particular location and add it to the Chart Datum, you can determine the true depth of water at a particular time.
2. Identify high tide information. The high tide is always the larger number in a tide chart, sometimes with a plus sign before it. This number shows how high above Chart Datum the tide will be at its greatest swell.
Let us look at some examples. In the chart below the high tides are marked with the letter H in the High/Low column, so it is really easy to find them. As we can see, on Wednesday, July 19th the first high tide is expected to occur at 00:48 (12:48 AM) GTM and is indicated as 6.08. This means, that at its highest, the water will be 6.08 feet above the average low watermark.
Important: When using a tide chart always take notice of which time zone the times are referenced to. In the chart below GTM time is used, so you would need to convert the time to local standard time.


Here is another chart for the same date and location, but notice how it looks completely different at first glance. The reason is that this chart uses LST/LDT time zone (Local Time with adjustment to Daylight Saving Time as appropriate).
According to this chart, the first high tide on Wednesday, July 19th is expected to occur at 07:08 AM and will rise 3.8 feet (116 centimeters) above the average low watermark.
The 6.08 feet high tide that we looked at in the previous example will actually occur on Tuesday, July 18th at 05:48 PM local time.
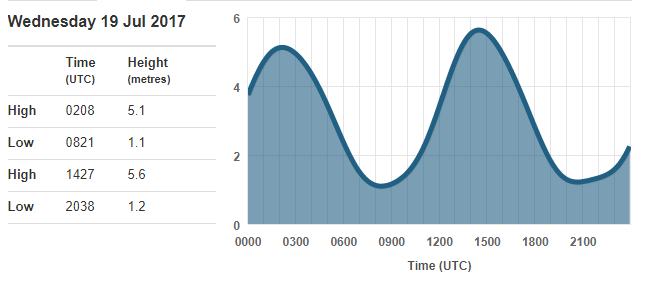
Sometimes tides can also be presented in the form of a graph, like the one below. For this example, we have chosen the same date, but a different location. Note, that the tide height here is expressed in meters, not feet. In this case, we see that the first high tide is expected to occur at 02:08 (2:08 AM) and will rise 5.1 meters (16.7 feet) above Chart Datum.
3. Identify low tide information. Low tide will be expressed as a smaller, or possibly even a negative number. If the number is positive, the water depth at its lowest ebb will still be above Chart Datum. In case the number is negative, low tide will fall below the average low watermark. For example, if the low tide is expressed as -1, it will be one foot below Chart Datum.
Use the Rule of Twelves
In case you are using the table that only expresses the final figures, i.e. the height during the low and the high times, you can calculate the interim numbers using the rule of twelves.
The base behind the rule of twelves is that the tides fluctuate over a period of six-plus hours, therefore, the range of tides can be divided into 1/12th units. To make it simpler, we’ll show the calculation method by example.

Tides Dictionary
Finally, to help you understand and remember the most basic terms related to tidal influences, we have composed this small dictionary.
TIDAL CURRENT - the horizontal movement of water caused by the tides.
FLOOD - the incoming tide, culminating in a "high" tide.
EBB - the flowing back of the tide, culminating in a "low" tide
SLACK - the time between the high/low or low/high tide
SEMI-DIURNAL TIDES - two tide cycles per day.
DIURNAL - one tide cycle per day.
MIXED TIDE - a tidal cycle that contains two unequal high tides and two unequal low tides.
ZERO TIDE HEIGHT (Chart Datum) - the average height of all the low tides, the standard, from which all other heights are measured.